
With the adoption of fair value accounting standards—that often necessitate complex option-based valuations, increasing complexity of many private and public company capital structures, and pervasiveness of valuations that employ Monte Carlo analysis—volatility has become a core valuation assumption in many appraisals. Depending on the interest being valued, the conclusion of the analysis may be even more sensitive to the assumed volatility than to other core enterprise-level assumptions like the weighted average cost of capital or even the valuation multiples. This article outlines a general approach for measuring, and discusses key considerations in selecting and adjusting, an estimated equity volatility assumption. Although there are other types of volatility that may be frequently relevant to some appraisers, such as revenue or commodity price volatility, hereafter, unless otherwise stated, any reference to volatility will refer to volatility of the equity value.
Volatility is a complex variable with numerous applications. In the context of equity valuation, volatility describes the magnitude of potential changes in the value of the equity. Unlike the mean or median, which are measures of central tendency, volatility is a measure of dispersion around the measure of central tendency. More specifically, equity volatility is a measure of the standard deviation of the equity growth rate. Standard deviation is a measure of dispersion around a normally distributed random variable, such as the equity growth rate. The normal distribution describes the probability that the value of a normally distributed random variable is within a certain range and relies on the standard deviation to set that range and estimate the probability of certain outcomes. Therefore, it is often necessary to calculate an estimated volatility in valuations that require probabilistic models, such as option pricing models, valuations of derivatives, stock-based compensation, contingent consideration, or other types of Monte Carlo analyses.
ESTIMATING VOLATILITY
Models that rely on volatility generally assume that volatility is a known and constant variable. However, volatility is not directly observable and must be inferred based on the best available information. To estimate the equity of a privately held company, it is generally necessary to select a peer group of publicly traded comparable companies. For each of the publicly traded companies, there are two primary measures of volatility: historical volatility and implied volatility. These measures can be used to derive a point estimate of volatility for each entity based on the appraiser’s relative degree of confidence in each. Finally, in selecting a point estimate of volatility for the subject company, it is necessary to adjust the volatility to account for the leverage of the subject company relative to the publicly traded comparable company.
CALCULATING HISTORICAL VOLATILITY
As discussed previously, volatility refers to the standard deviation of the equity growth rate. Historical volatility is a measure of the actual volatility of a publicly traded company’s stock price over time. The goal of the historical volatility analysis is to inform the selection of a point estimate of the expected annualized volatility over the term or holding period of the interest being valued. To calculate historical volatility, the appraiser must construct an analysis of the peer group companies’ stock prices over time and then calculate the change in the stock price over each period. The historical volatility is the standard deviation of the percentage changes in value, as detailed below.
CONTINUOUSLY COMPOUNDED GROWTH RATE
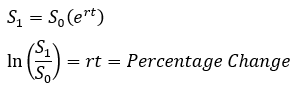
The models that require volatility input are generally based on continuously compounded growth models. For example, whereas a typical growth rate equation may take the form of (1+i)t, where i represents the annual effective growth rate (or the effective rate for the period corresponding to t), the Black-Scholes equation takes the general form of ert, where r represents the continuously compounded rate of return.1 Because the equations that rely on volatility rely on a continuously compounded rate of return, in estimating the historical volatility the appraiser should calculate the historical continuously compounded percentage change between each stock price observation, as shown below. At this step, adjustments for time have not yet been made and the change between each period is equal to rt.
ANNUALIZING VOLATILITY
Volatility is generally expressed as the annualized standard deviation of the continuously compounded rate of return. As noted previously, the appraiser must construct an analysis calculating the growth rate of equity values over various time intervals, which is usually done on either a daily or weekly basis. In this case, the volatility that is calculated based on these growth rates will represent the volatility corresponding to whatever period the appraiser selected. Considering that volatility is a measure of dispersion, and corresponds to the range of potential outcomes, it follows that the volatility of the daily rate of return will be considerably less than the annualized volatility. Although the proof is outside the scope of this article, volatility is not proportional to time. Variance, however, which is a statistical measure equal to volatility squared (variance = σ2) is proportional to time (or accumulates at a rate of one per unit time) and can be adjusted accordingly, as shown below. For a daily model, there are assumed to be 252 trading days in a year.
.png)
SELECTING A TIME INTERVAL
The standard deviation of historical stock-price growth can be calculated using data from lookback periods of various length. Typically, appraisers will consider data from lookback periods ranging from one to five years. In relying on the historical indications, appraisers should consider whether there are factors that would cause results from the historical data to not reflect the expected volatility for the subject interest over its assumed holding period. Examples of abnormal events include periods of extreme market or commodity price volatility, idiosyncratic factors or events such as failed takeover bids or acquisitions, or post-IPO periods of increased volatility. If these events are unlikely to occur over the assumed term of the interest being valued, then it is generally reasonable to make an adjustment to exclude those data points or reduce their weighting. Additionally, although a statistical discussion of volatility is outside the scope of this article, volatility is generally considered to be mean-reverting. If the subject company is in a period of extreme volatility, it may be reasonable to assume that the volatility may decline over the assumed term unless the recent volatility can be explained by an ongoing factor that is expected to be permanent.
In financial reporting valuations, it is common practice for appraisers to select, and for auditors to expect, a historical lookback period corresponding to the term of the interest being valued, an approach that we refer to as the “Symmetrical Lookback Method.” For example, if the appraiser is valuing a two-year option using the Black-Scholes Equation, auditors will commonly expect the appraiser to rely on a two-year lookback period. Some valuation professionals are in the practice of indiscriminately applying the Symmetrical Lookback Method. We believe that this is incorrect and has resulted from a misinterpretation of the relevant Accounting Standards Codification (ASC).
Some technical guides suggest that ASC 718 requires that historical realized volatility be measured over a lookback period commensurate with the expected or contractual term of an option, which we believe is an incorrect interpretation. This conclusion is drawn from ASC 718-10-55-37 (a), which states, “Volatility over the most recent period is generally commensurate with either [the contractual or expected term of the option, as applicable].” Although it is ambiguous, notably missing from that passage is an imperative statement that requires reliance on a lookback period consistent with the expected or contractual term of the option and ASC 718-10-55-36 states that “[ASC 718] does not specify a method of estimating expected volatility.” Furthermore, the Securities and Exchange Commission’s (SEC) Staff Accounting Bulletin (SAB) Topic 14.D.1 states, “The [SEC] believes that [a company] could utilize a period of historical data longer than the expected or contractual term, as applicable, if it reasonably believes the additional historical information will improve the estimate.” Considering the foregoing, our interpretation of the statement from ASC 718-10-55-37 (a) is that the Symmetrical Lookback Method is only a suggested starting point for calculating historical volatility and that additional considerations, such as anomalies in the historical data set, should also be taken into account when determining the lookback period.
From an economic perspective, indiscriminate application of the Symmetrical Lookback Method does not always produce results consistent with the market-participant expected volatility due to the innumerable economic factors that can render historical volatility indications a poor measure of expected volatility, as discussed previously. In each case, the appraiser should consider whether the historical data reasonably reflects the expectations for the company over the expected or contractual term of the option.
ASC 718-10-55-35 through 718-10-55-41 outlines various factors that should be considered in selecting an assumed volatility. Ultimately, the decision of the appropriate lookback period should include a significant degree of professional judgment.
CALCULATING IMPLIED VOLATILITY
Implied volatility refers to the volatility implied by the market prices of an entity’s publicly traded options. Publicly traded options are generally priced using the Black-Scholes formula, which relies on a variety of inputs in order to estimate the value of a stock option. As all of the inputs to the equation are directly observable (such as price of the underlying asset, strike price, interest rate, dividend rate, and term of the option) and the price is known, the only unknown and unobservable variable to the equation is the volatility. The implied volatility is the volatility that causes the value of an option implied by the Black-Scholes formula to be equal to the option’s publicly quoted price.
OBTAINING IMPLIED VOLATILITY DATA
While it is possible to manually calculate implied volatility based on publicly quoted options prices, implied volatilities can be more easily obtained from brokers and financial data providers. Some providers, such as Bloomberg, have robust information on options chains and trade history. Alternatively, raw historical data on options chains and implied volatilities can be obtained from the Chicago Board Options Exchange on a per-security basis, but appraisers will need to analyze the data sets to select an implied volatility for each maturity date.
EVALUATING IMPLIED VOLATILITY DATA
Implied volatilities are commonly considered for 3-month, 6-month, 12-month, 18-month, and 24-month options contracts. Although implied volatilities are not constant across strike prices, implied volatilities are generally calculated based on transactions in options that are either at-the-money or close to being at-the-money as there is typically greater liquidity and more reliable indications from these options. When evaluating reported volatilities from data brokers, it is important to consider whether there were actual transactions in the options. There may be quoted implied volatilities based on the bid/ask of the public options, but no actual transactions, or, in other cases, may be derived from either infrequent or dated actual transaction data, which may not be reliable.
SELECTING A POINT ESTIMATE
Once the appraiser has calculated the various indications of historical and implied volatility for each of the publicly traded peer group companies, there are a number of approaches to estimate the volatility for the subject entity. Typically, the appraiser will select a point estimate of volatility for each entity based on his or her relative degree of confidence in each indication. For example, a point estimate could be based on a weighted average of a selected historical volatility indication and average implied volatility.
ADJUSTING FOR LEVERAGE
As discussed, volatility is a measure of the dispersion of changes in stock prices over time. Percentage changes in equity value are heavily influenced by financial leverage. Unadjusted historical and implied volatility indications represent leveraged indications of volatility.
DE-LEVERING VOLATILITY
Much like a calculation of beta, it is necessary to adjust each of the peer group companies’ point estimates of volatility to account for the capital structure of each entity. In order to make this adjustment, the appraiser needs to select a debt-to-capital assumption corresponding to the assumed point estimate. If there have been significant changes in a company’s capital structure over time, it may be necessary to use different assumptions to de-lever the historical and implied volatilities and calculate a weighted-average unlevered point estimate. For example, if a company’s debt-to-capital was historically very low, but it recently made a leveraged acquisition, its implied volatilities may greatly exceed its historical volatilities, and it would be inappropriate to de-lever the historical volatilities using the company’s current debt-to-capital. The unlevered volatility indication is sometimes referred to as the “asset volatility,” as it represents an estimate of the volatility for the company if it had no debt.
RE-LEVERING VOLATILITY
Once the appraiser has obtained a weighted-average unlevered point estimate of volatility, it is necessary to select a debt-to-capital to re-lever the indication. This should generally reflect the expected debt-to-capital of the subject company over the assumed term. Additionally, there are some valuations that may require scenario-specific leverage adjustments. For example, if an appraiser is valuing preferred equity as a debt-like interest and excluding it from the calculation of residual equity, then it would be appropriate to treat that preferred equity as debt in order to estimate the debt-to-capital ratio. More generally, the total debt selected in calculating the debt-to-capital ratio should correspond to the interests deducted from the market value of invested capital.
METHOD FOR DE-LEVERING AND RE-LEVERING
There are multiple methods to de-lever and re-lever equity volatility. One common approach is a variation of the Hamada Equation, which is commonly used to de-lever and re-lever equity betas.2
.png)
This approach is commonly applied due to its ease of use. However, when dealing with companies with large amounts of financial leverage, it may generate extremely high indications and may be an unreliable model (depending on the degree of leverage). Although models exist to integrate time-varying volatility estimates, most closed-form option models make the simplifying assumption that volatility is fixed and known over the duration of the option. For a highly leveraged company, the volatility implied by the modified Hamada Equation may be subject to significant changes as financial leverage changes—as equity value increases, the leverage would likely decrease, thereby reducing the financial leverage and volatility. Therefore, for highly leveraged companies, this approach may overstate the volatility of the equity over the relevant term, depending on the degree of leverage. A method to de-lever and re-lever equity volatilities for highly levered companies is discussed in Chapter 6.36 (and illustrated in Table I-13) of the AICPA Practice Aid, “Valuation of Privately Held-Company Equity Securities Issued as Compensation.”
CONCLUSION
Volatility is a core assumption for many valuation models, but it is not directly observable. Historical and implied indications of volatility of comparable publicly traded companies provide a basis for appraisers to develop a reasonable estimate, but consideration should be given to the applicability of that data point to the subject company’s current and prospective financial position. Where possible, adjustments to the weightings, indication, and leverage should be made to improve the appraiser’s point estimate. Although there are many complex considerations not discussed herein, this article provided a general framework that should assist appraisers in performing and evaluating volatility calculations.
1Conceptually, the continuously compounded rate of return allows for accumulation of a growth rate that has an infinite number of compounding periods.
2See Hamada, R., “The Effect of the Firm’s Capital Structure on the Systematic Risk of Common Stocks,” Journal of Finance, pp. 27, 435-452 (1972).